How to Improve Conversion Rates: A Practical Guide to Growth

Updated: May 14
If you want to improve your conversion rates, you can't just start changing things randomly. You first have to figure out where people are dropping off in your sales funnel and then run targeted experiments to fix those specific sticking points. This means getting your hands dirty with analytics, heatmaps, and session recordings to find high-traffic pages with poor performance, forming data-backed ideas, and then systematically testing changes.
Your Starting Point: Diagnosing Conversion Bottlenecks
Before you can fix what's broken, you need to know where the cracks are. The real first step of any successful Conversion Rate Optimisation (CRO) programme is getting a crystal-clear picture of where and why users are getting stuck. It’s incredibly tempting to jump straight into testing new button colours or headline copy, but without a solid diagnosis, you're just guessing.
True optimisation begins with a deep dive into user behaviour. You need to move beyond surface-level metrics like your overall bounce rate and dig into the actual journey people take on your website. This is where you turn raw numbers into actionable insights that can actually move the needle.
Pinpointing High-Impact Problem Areas
Your goal here is simple: find the pages that represent the biggest opportunities for improvement. These are typically pages that get a lot of traffic but have a huge drop-off rate, stopping users from moving to the next stage of their journey.
A B2B tech company, for instance, might notice their “Request a Demo” landing page gets thousands of visits from paid ads but has a meagre 2% form submission rate. That’s a massive bottleneck bleeding cash.
Likewise, an e-commerce store might see a product page with tons of traffic but a disappointingly low “add-to-cart” rate. This screams that there's a potential issue with the product description, imagery, pricing, or the call-to-action. By zeroing in on these high-traffic, low-performance pages, even small tweaks can lead to substantial returns.
"Data-driven diagnosis isn't just about finding problems; it's about finding the right problems to solve. Fixing a small leak on a high-traffic page is far more valuable than perfecting a page hardly anyone visits."
Leveraging a Mix of Analytical Tools
A proper diagnosis relies on a blend of quantitative and qualitative data. Think of it like being a detective, each tool gives you a different clue, helping you understand not just what is happening, but why.
Website Analytics (e.g., Google Analytics): This is your starting point for spotting broad trends and potential red flags. Use it to identify pages with high exit rates or abysmal conversion rates. You can learn more about the role of analytics in shaping marketing decisions to build a solid foundation.
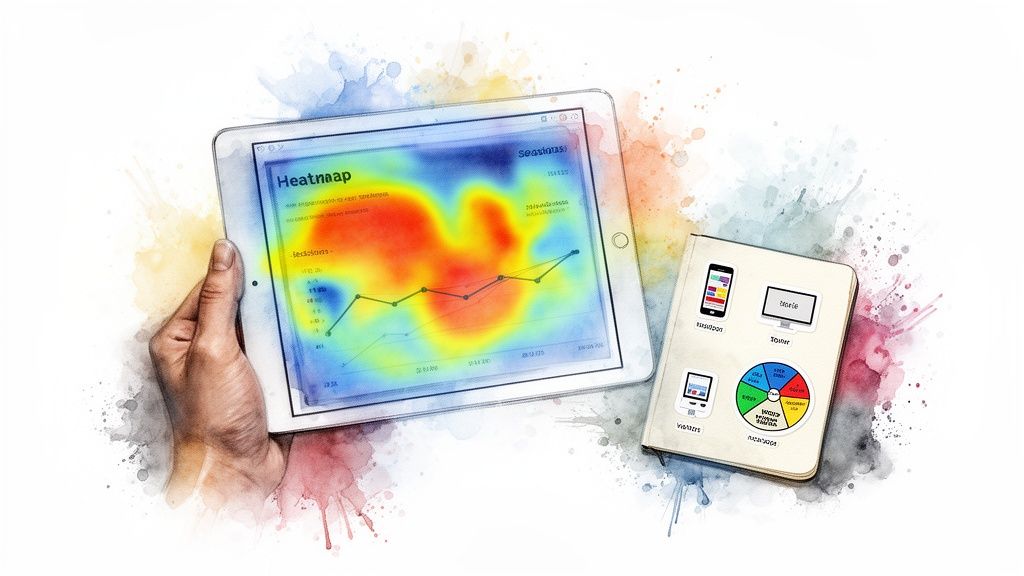
Heatmaps: These tools are fantastic for visually showing where users click, move their mouse, and scroll. Heatmaps can quickly reveal if users are clicking on things that aren't clickable or entirely ignoring your main call-to-action.
Session Recordings: There's nothing quite like watching anonymised recordings of real user sessions. This gives you invaluable context, letting you see firsthand where users hesitate, rage-click in frustration, or abandon a form halfway through.
The Power of Segmentation
Not all users are the same, and their challenges often differ. Segmenting your audience is critical for uncovering hidden bottlenecks that only affect specific groups. Digging into your data based on these segments can reveal some astounding insights.
For instance, you might discover that mobile users convert at half the rate of desktop users. This could point to a clunky mobile user experience, like a checkout form that’s a nightmare to use on a small screen. To really get a handle on this, a comprehensive data-driven playbook for improving ecommerce conversion rates can be a game-changer.
Other valuable segments to look at include:
New vs. Returning Visitors: Are new users struggling to grasp your value proposition?
Traffic Source: Do visitors from paid search behave differently from those coming from organic search?
Geographic Location: Are there regional quirks in user behaviour or preferences?
By combining these diagnostic techniques, you build a clear, data-supported picture of your conversion barriers. This informed approach ensures your optimisation efforts are strategically aimed at the areas that promise the biggest, most impactful returns.
Building Your CRO Framework for Consistent Growth
Once you’ve dug into the data and mapped out your website’s problem areas, it’s time to get organised. Raw data is just noise until you have a system to turn those insights into smart, actionable experiments. This is where a solid Conversion Rate Optimisation (CRO) framework comes in, moving you from guesswork to a repeatable engine for growth.
The whole process starts by setting goals that actually mean something. An objective like “improve the homepage” is far too vague to be useful. You need to be specific and measurable. Think more along the lines of, “increase sign-ups from the homepage by 15% in Q3.” This kind of clarity gets your entire team pointing in the same direction and focused on a tangible finish line.
Crafting a Strong, Testable Hypothesis
With a clear goal in place, your next move is to form a hypothesis. This isn’t just a random idea you pull out of thin air; it’s a simple, testable statement that proposes a change, predicts what will happen, and, most importantly—explains why you think it will happen.
A well-structured hypothesis almost always follows this classic format: “If we [implement this change], then [this outcome will occur] because [this reason].”
Let's imagine a SaaS company. Their hypothesis might sound like this: “If we change the main call-to-action on our pricing page from 'Get Started' to 'Start Your Free 14-Day Trial', then we’ll see a 20% increase in trial sign-ups because the new copy spells out the no-cost entry point and dials down the user's fear of commitment.”
See how that works? This structure forces you to think critically about the why behind your test, connecting it directly back to the user behaviours you spotted during your initial diagnosis. Building your strategy around a proven CRO framework is the only way to achieve consistent, meaningful results.
A weak hypothesis is just an idea. A strong hypothesis is a data-informed statement that can be definitively proven or disproven through testing. It's the scientific method, but for your marketing.
Prioritising Your Experiments with ICE and PIE
You’re going to come up with dozens of great hypotheses, but you can’t possibly test them all at once. This is where prioritisation becomes your best friend. It ensures your team’s valuable time is spent on ideas that will actually move the needle. Two of the most effective and widely used frameworks for this are ICE and PIE.
These models give you a simple, objective way to score each idea, which helps remove personal bias and the “loudest voice in the room” from the decision-making process.
ICE Score: This framework has you rate each idea on a scale of 1-10 across three criteria: Impact (How big of a deal will this be if it works?), Confidence (How sure are we this will actually work?), and Ease (How simple is it to implement?). Your final score is just the average of the three.
PIE Score: This is a similar model that uses Potential (How much room for improvement is there on this page?), Importance (How valuable is the traffic to this page?), and Ease (How difficult will it be to run this test?).
Don't think of these frameworks as rigid rules. They're guiding principles designed to help you compare different ideas on a level playing field. They force a disciplined approach, making sure you tackle the high-impact, low-effort opportunities first.
ICE vs PIE Prioritization Frameworks
Choosing between ICE and PIE often comes down to your team's maturity and business goals. Here’s a quick comparison to help you decide which one is the right fit.
Framework | Scoring Criteria | Best For |
|---|---|---|
ICE | Impact: The potential effect of a successful test. Confidence: Your belief in the hypothesis. Ease: The effort required to implement. | Teams that need a fast, simple method for ranking a large backlog of diverse test ideas. It's great for getting started. |
PIE | Potential: Room for improvement on the target page. Importance: Value of the page's traffic. Ease: The technical and resource cost. | Teams that want to add more business context. It prioritises tests on high-value pages, linking CRO directly to revenue. |
By adopting one of these models, you’re not just picking tests at random; you’re creating a transparent and logical roadmap for your entire experimentation programme. This systematic process ensures that your CRO efforts aren't just a series of disconnected tests, but a cohesive strategy designed for consistent, measurable growth. This foundational work sets the stage for everything that follows—designing and running the tests that will ultimately lift your conversion rates.
The Engine of Optimisation: Designing and Running Effective Tests
With a prioritised list of data-backed hypotheses in hand, it's time to move from planning to action. This is where your strategy truly comes to life. Designing and running clean, effective tests is the core engine of any successful CRO programme, turning your informed ideas into measurable performance improvements.
The world of testing can seem complex, but it really boils down to one simple idea: comparing different versions of a page or element to see which one performs better against your goals. There are a few key types of tests, and choosing the right one depends entirely on the scope and nature of your hypothesis.
This simple visual flow shows how your goals, hypotheses, and prioritisation lead directly into the testing phase.
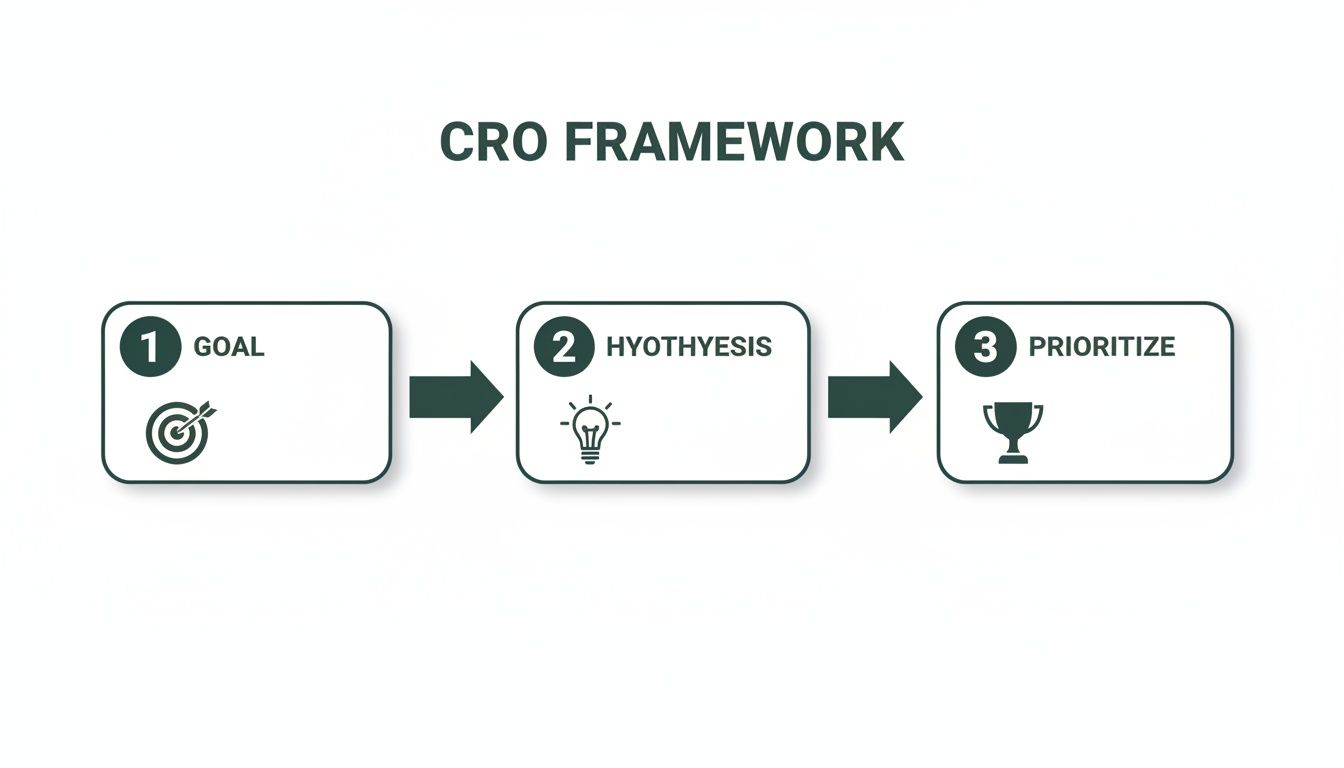
It’s a clear reminder that testing isn't a random act. It's the logical outcome of a structured diagnostic and planning process.
Choosing Your Testing Method
Not every hypothesis requires the same kind of experiment. Understanding the primary methods ensures you gather the cleanest data possible for your specific question.
A/B Testing (or Split Testing): This is your bread and butter—the most common and straightforward method. You create a variation (Version B) of a page and split your traffic between it and the original (Version A). It’s perfect for testing isolated changes like a new headline, a different call-to-action button colour, or a revised product description.
Multivariate Testing: Think of this as A/B testing on steroids. It's a more complex approach where you test multiple changes at once. For example, you might test three different headlines and two different images on the same page. The software then shows different combinations to users and tells you which combination performs best. This is ideal for optimising several elements on a high-traffic page simultaneously.
Split URL Testing: Instead of testing elements on a single page, this method splits traffic between two entirely different URLs. It's the right choice for radical redesigns or when you want to test an entirely new user flow, like a multi-step checkout versus a single-page checkout.
For a deeper dive into applying these tests, check out our guide on how to build high-conversion landing pages, which covers practical design and testing examples.
Ensuring Your Test Results Are Trustworthy
Running a test is one thing; getting results you can actually trust is another. Two concepts are absolutely critical here: sample size and statistical significance. Rushing this part is one of the most common mistakes I see, and it consistently leads to bad business decisions based on faulty data.
Sample size refers to the number of users who need to see your test before you can make a reliable conclusion. If your sample size is too small, your results could easily be skewed by random chance. Most testing tools will help you calculate the required sample size based on your current conversion rate and the uplift you expect to see.
Statistical significance is your confidence level. A result that is 95% statistically significant means there is only a 5% chance that the outcome was a fluke. Always wait for your test to reach this threshold before you even think about declaring a winner.
Ending a test early because you see a big initial lift is like calling a football match after the first ten minutes. You need to let the game play out to get a true result. Patience in testing is non-negotiable.
Leveraging Modern CRO Tools
Gone are the days when you needed a developer on standby for every small change. Modern testing platforms have made it incredibly easy for marketers to set up and launch experiments with visual editors, taking the technical headache out of the process.
These platforms handle all the heavy lifting for you, including:
Splitting traffic evenly and randomly.
Tracking conversions for each variation.
Calculating statistical significance automatically.
The impact of systematic testing can't be overstated. A pivotal statistic for UK businesses in 2025 reveals that A/B testing drives up to 30% lifts in conversion rates. Top performers are achieving median rates of 6.6% across industries, far surpassing the 2.9% average.
For venture-backed SaaS founders and B2B scale-ups, this data is gold. Research highlights how systematic testing in the UK B2B services sector, which averages 4.94% conversions, can lead to significant gains when combined with user feedback.
By selecting the right test, ensuring your data is reliable, and using the right tools, you transform optimisation from a guessing game into a scientific process. Each test—whether it wins or loses—provides valuable insights that get you one step closer to understanding your customers and improving your bottom line.
Using Personalisation and AI to Take CRO to the Next Level
Standard A/B testing is a workhorse, no doubt. But the real game-changing gains in modern CRO come when you stop treating your audience as a single, monolithic entity and start treating them like individuals. This is where personalisation and AI step in, moving you beyond simple tests into a world of dynamic, relevant user experiences.
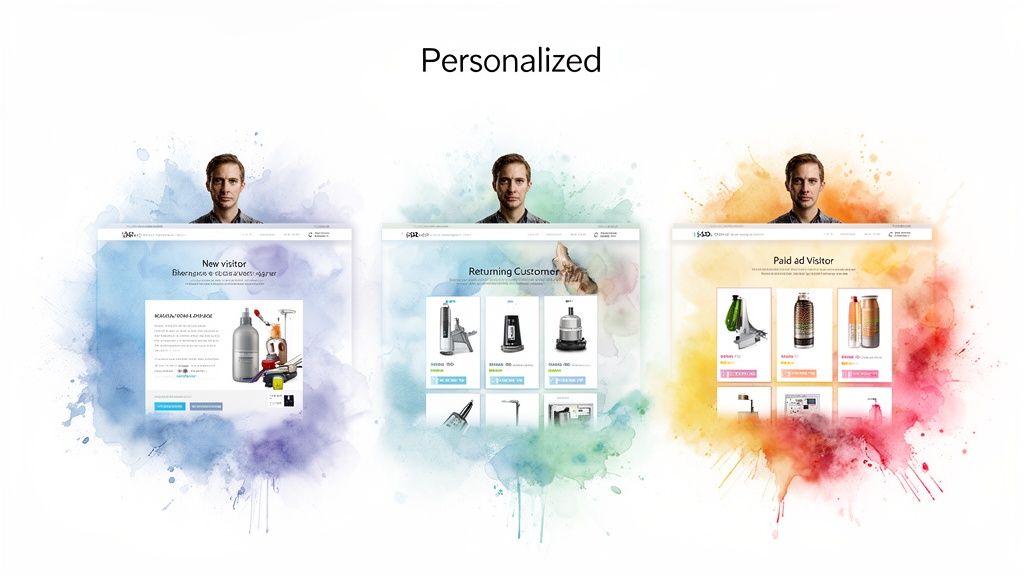
The idea is straightforward: tailor the user journey based on whom the person is. That could mean adjusting the experience based on their behaviour, their demographic, or even how they landed on your site in the first place. When you stop showing everyone the same generic message, conversions just naturally follow because the experience feels more intuitive and genuinely helpful.
Tailoring the Experience with Dynamic Personalisation
True personalisation is so much more than just sticking a tag in an email. It’s about dynamically altering the content, offers, and visuals a user sees in real-time. This is how you create an adaptive, high-converting journey that feels unique to every single visitor.
Let’s look at a few practical examples:
For E-commerce: A returning customer lands on your homepage. Instead of a generic “Welcome Back,” they see a banner showcasing new arrivals in the exact category they bought from last time.
For B2B Tech: A visitor arrives from a paid search ad for “project management software”. The landing page headline instantly changes to “The (1) Project Management Tool for Agile Teams,” perfectly matching their search intent.
For SaaS: A user on your free plan logs in and gets a targeted in-app message. It highlights a premium feature directly related to what they’ve been doing in the product, giving them a gentle nudge towards an upgrade.
These tailored interactions make users feel understood. They slash friction and dramatically increase the odds of a conversion. It's a fundamental shift from a one-size-fits-all approach to a one-to-one conversation. We actually dive deeper into this in our article on the power of personalization in growth marketing.
Personalisation transforms your website from a static brochure into a responsive sales assistant. It listens to what the user needs and adjusts its pitch accordingly, making the path to conversion feel like a natural next step.
Personalisation is quickly becoming a non-negotiable for UK conversion rates. An incredible 80% of customers are willing to pay more for tailored experiences. Done right, this can boost conversions by up to 400%, a vital stat given that British shoppers often outperform their US counterparts thanks to smartly localised strategies. While UK e-commerce averages a 1.7-1.8% conversion rate, sectors like Health and Wellbeing are hitting 3.5% or more by using clever recommendation engines. In SaaS, AI-powered chatbots are delivering uplifts of 27%, proving invaluable for building B2B pipelines.
Integrating AI to Accelerate CRO Workflows
Artificial intelligence isn't some far-off concept any more; it's a practical toolkit that can put your entire CRO process on steroids. AI helps you work faster and smarter, from digging up opportunities to analysing test results. Think of it as a powerful assistant, freeing up your team to focus on the big-picture strategy and creative thinking.
By weaving AI into your workflow, you can speed up several key parts of your optimisation programme.
Hypothesis Generation: AI tools can crunch through thousands of user sessions and data points to spot patterns and suggest high-impact test ideas that a human might completely miss.
Copywriting and Variant Creation: Need five different headline variations for a landing page test? AI can spit them out in seconds, each angled towards a different user persona or emotional trigger.
Predictive Analytics: More advanced AI models can even predict which user segments are most likely to respond well to a change before you even launch the test, helping you prioritise your experiments with much greater confidence.
For instance, a B2B SaaS company could use AI to analyse customer support chats and pinpoint common frustrations. The AI might then hypothesise that adding a specific FAQ section to the pricing page will reduce hesitation. It could even draft the initial copy for you to test. This blend of machine intelligence and human oversight creates a far more efficient, data-driven optimisation cycle. It lets you run more experiments, learn faster, and ultimately improve your conversion rates at a pace that just wasn't possible before.
Your CRO Playbook Depends Entirely on Your Business Model
While the core principles of CRO, finding bottlenecks, testing hypotheses, are universal, how you apply them is anything but. A one-size-fits-all approach to optimisation is a recipe for wasted effort. The game you’re playing completely changes depending on whether you're selling trainers, enterprise software, or a monthly subscription.
An e-commerce brand’s make-or-break moments are worlds apart from a B2B tech company's lead funnel. A SaaS startup has its own unique set of growth loops to worry about. By tailoring your strategy to your specific business model, you focus on the levers that actually move the needle, accelerating growth far more effectively than any generic tactic ever could.
Let's break down what that looks like in the real world.
E-commerce Optimisation: The Final Yards of the Sale
For any e-commerce brand, the real battles are won and lost on the product page and in the checkout flow. These are the two biggest drop-off points, where a browser either becomes a buyer or bails. Your optimisation efforts have to be laser-focused on crushing friction and building trust at these critical moments.
Too many brands treat their product pages like static catalogue entries. That’s a huge mistake. Your product page is your most important sales pitch.
Bring Your Products to Life: Ditch the boring studio shots. Show your product in the wild with lifestyle photos, 360-degree views, and quick videos of it in action. You need to help customers visualise it in their lives.
Talk Benefits, Not Just Specs: Don't just list features; translate them into clear benefits. Instead of “down-filled insulation” for a winter coat, try “Stay warm and comfortable down to -10 °C.” One is a feature, the other is a solution.
Show, Don’t Just Tell, with Social Proof: Pull customer reviews, ratings, and user-generated photos right onto the page. Nothing builds confidence faster than seeing that real people have bought, and loved—your product.
Just as crucial is clearing the path to purchase. Cart abandonment is a massive revenue leak, and the usual suspects are unexpected shipping costs or a clunky, confusing checkout. Is a multi-step checkout with a progress bar better than a single-page version? There's only one way to find out for your audience: test it.
B2B Tech: The Art of the High-Value Handshake
In the B2B world, the goal isn't usually an instant transaction. It’s about starting a conversation. The conversion shifts from “Add to Cart” to “Request a Demo” or “Download Our Report.” The central challenge here is a delicate balancing act: you need to capture high-quality data without scaring prospects away with a high-friction experience.
Long, intimidating forms are notorious conversion killers. Every single field you add is another reason for a potential lead to give up.
For B2B lead generation, think of each form field as a tiny cost you're asking the user to pay. Your job is to ensure the value you're offering in return—the demo, the e-book—is perceived as being worth more than the cost of their information.
This is where progressive profiling comes in. On the first interaction, just ask for a name and email. That's it. Once they're in your ecosystem, you can ask for more details like company size or job title on their next visit. This dramatically lowers the initial barrier to entry while still letting you build a rich, qualified lead profile over time.
SaaS Startups: Nailing the Journey from Sign-up to Success
For a SaaS startup, CRO is about optimising the entire user journey. The key moments that define your growth are the initial sign-up, the onboarding experience, the path from a free plan to a paid one, and the clarity of your pricing page.
A seamless onboarding process is everything. If a new user gets lost or confused in their first five minutes, they’re gone, probably forever. You have to guide them to that “aha!” moment as fast as humanly possible using tooltips, checklists, and interactive walkthroughs.
The pricing page is another high-stakes battleground. Ditch the feature lists and use clear, benefit-driven language to explain your plans. Even better, frame each tier for a specific user, like “Best for freelancers” or “Perfect for small teams.” This helps prospects immediately see where they fit, reducing decision paralysis, and choosing to upgrade feel natural.
A brief look at the UK eCommerce landscape shows just how critical a smooth user experience is. The average conversion rate recently hit 1.8%, with top-performing sectors like Arts and Crafts reaching an impressive 3.89%. But here’s the kicker: while desktop converts at around 3.2%, mobile is lagging at 2.8%. That's a gap you have to close, especially when you realise that over 60% of UK online traffic is now mobile. You can learn more about how to optimise for the UK market on adpage.io.
At Ryesing Limited, we build data-driven growth engines for ambitious brands. If you're ready to move beyond guesswork and start systematically improving your conversion rates, learn more about our strategic approach at

Frequently Asked Questions About Improving Conversion Rates
What is a good conversion rate?
There is no single “good” conversion rate, as it depends heavily on your industry, business model, traffic source, and the specific goal being measured. For example, a B2B SaaS company's demo request conversion rate will differ vastly from an e-commerce store's purchase conversion rate. The best benchmark is your own historical data. A good rate is one that is consistently improving over time through systematic testing and optimisation.
How do you improve conversion rates?
To improve conversion rates, you must follow a structured process:
Diagnose: Use analytics, heatmaps, and session recordings to identify high-traffic pages with poor performance or high drop-off rates.
Hypothesise: Formulate a data-backed hypothesis for why a change might improve performance (e.g., “Changing the CTA copy to be more specific will increase clicks because it clarifies the value”).
Test: Run controlled A/B or multivariate tests to compare your new version against the original.
Analyse: Measure the results to see if your change led to a statistically significant improvement.
Repeat: Implement winning changes and use learnings from all tests to inform the next cycle.
What is the formula for conversion rate?
The formula for calculating conversion rate is: (Number of Conversions / Total Number of Visitors) * 100 = Conversion Rate (%) For example, if your landing page had 1,000 visitors and 50 of them signed up for your newsletter, your conversion rate would be (50 / 1,000) * 100 = 5%.
Where should I start with conversion rate optimisation?
Always start with diagnosis. Before testing any changes, use analytical tools to find the biggest “leaks” in your conversion funnel. Focus your initial efforts on high-impact areas, which are typically pages that receive a lot of traffic but have low conversion rates. Fixing a problem on a page thousands of people see will deliver a much greater return than optimising a page with very little traffic.